We have several SBCs running and manage them for our customers. Usual it all works really great, but sometimes we have quality issues or call drops or somethin else. In that cases, it would be great to have really detailed information about each call and each SIP package. Our SBC provides a CDR that records all calls, but it has only limited information on the calls (From, To, Result, Duration, User Agent, ...). Of course there is the possibility to run a "Debug Trace" but that is not intended to run permanent and most issues occur when the debug is not running.
I looked for solutions to solve this problem and came across HOMER that is currently released in Version 7.
In this article, I will cover
- What is HOMER?
- What's the architecture of HOMER?
- Some Screenshots
What is HOMER?
HOMER is a Packet and Event capture system. It is specialized on VoIP / SIP Monitoring. It records every SIP & RTP Package that is sent and received by the SBC and logs it to a sophisticated storage system. The Web UI allows to deep dive into each call and analyze it to find any issues, latency or jitter problems. Also every SIP Registration is tracked to debug them.
HOMERs architecture
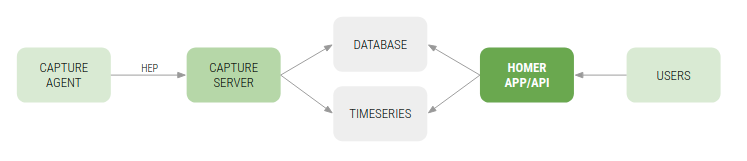
HOMER uses a combination of Timeseries and Relational databases like InfluxDB, PGSQL, Prometheus, ... to store all data. It allows to combine several sources like SIP Packages, Logs, RTP Packages to a big picture of your infrastructure. There are several SIP Solutions that have a built-in HOMER support, for all other solutions they offer capture agents that run on the system and capture the SIP/RTP Packages on the network interface and send them to HOMER.
There are three components of HOMER that are needed to run:
- heplify-server: Capture Server that collects all data and stores it in the DB.
- homer-app: API / Web UI to look at the data
- heplify: Capture Agent that sends the data to the heplify-server
This can be extended by other components like
- Grafana to view graphs and dashbarods
- paStash as log collector
- any HEP Client
How does it look like?
Here are some screenshots from the system:
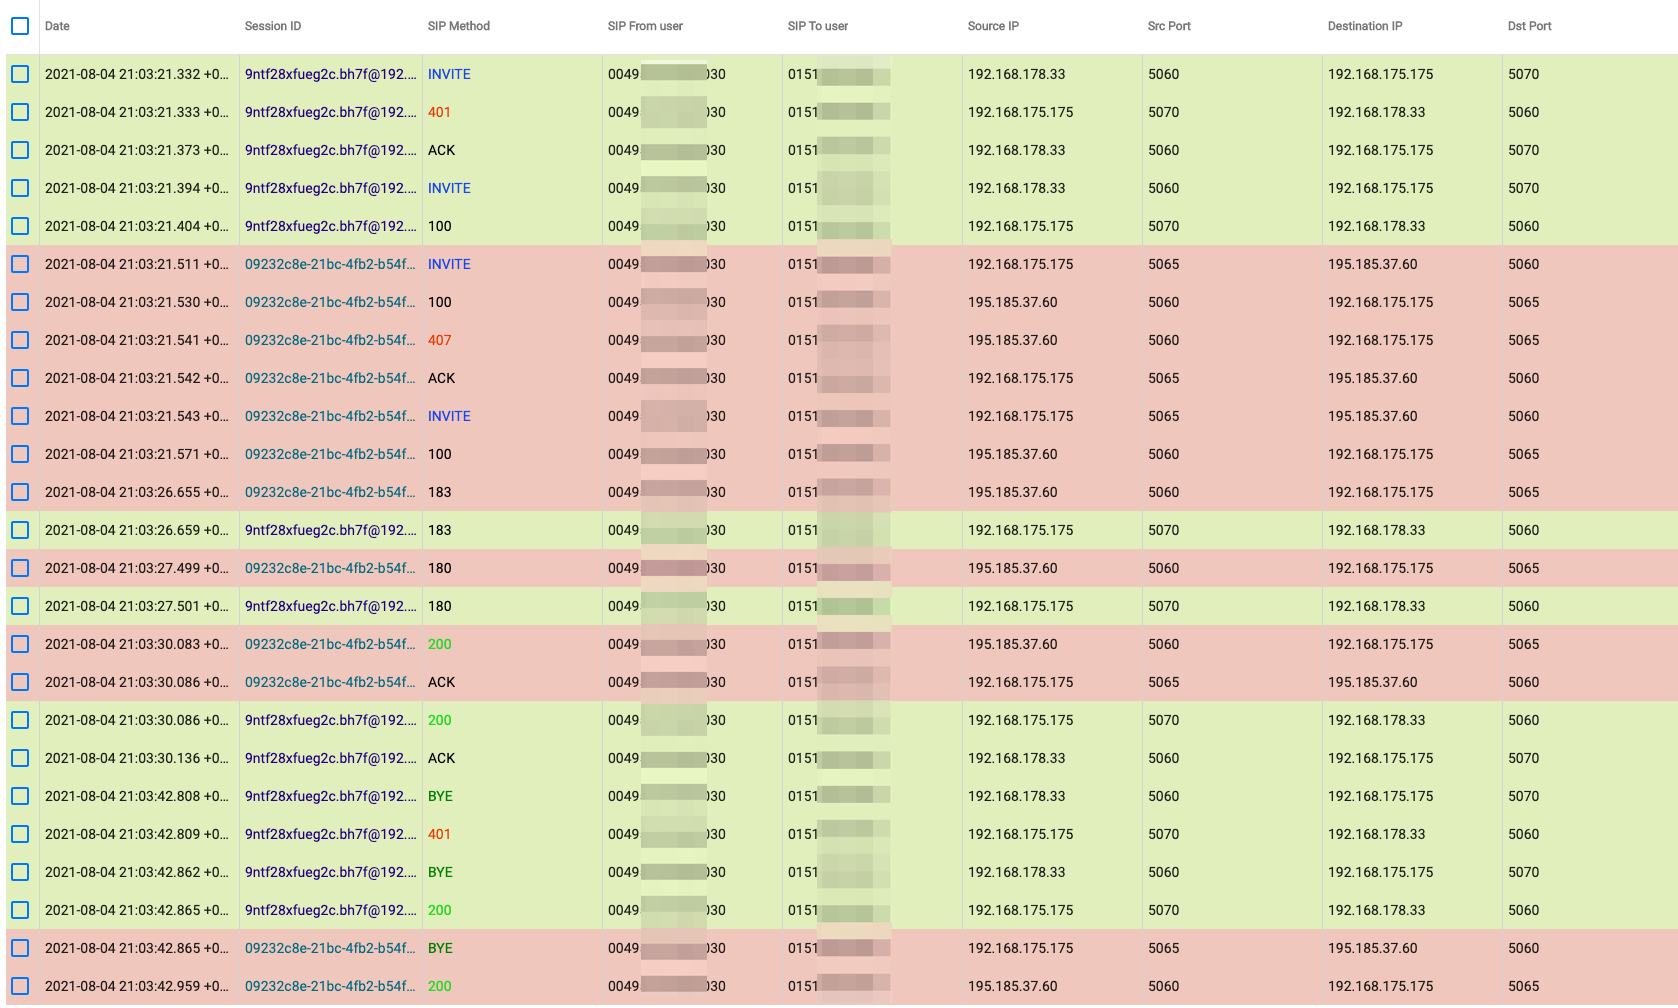
The Call / Package Overview:
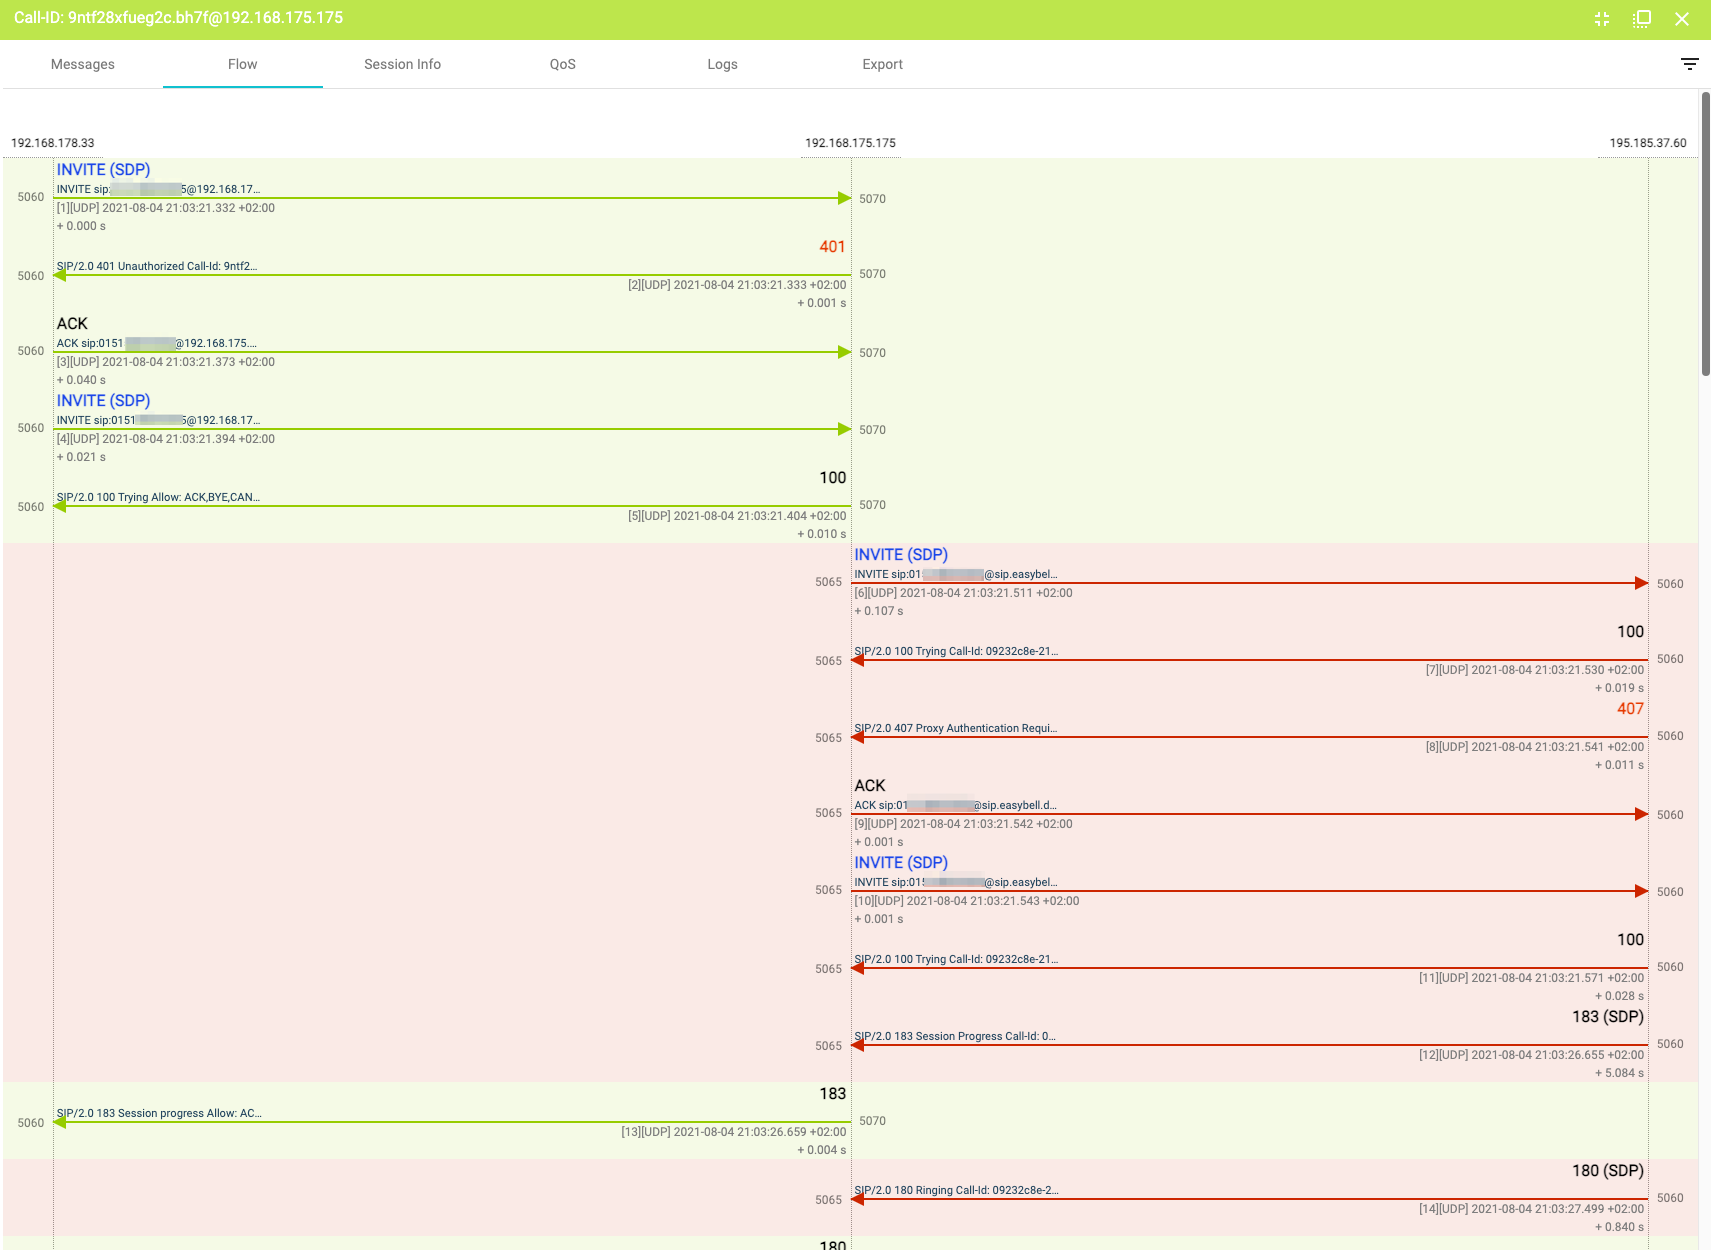
The Flow View of two combined calls (SIP Phone -> SBC and SBC -> Provider):
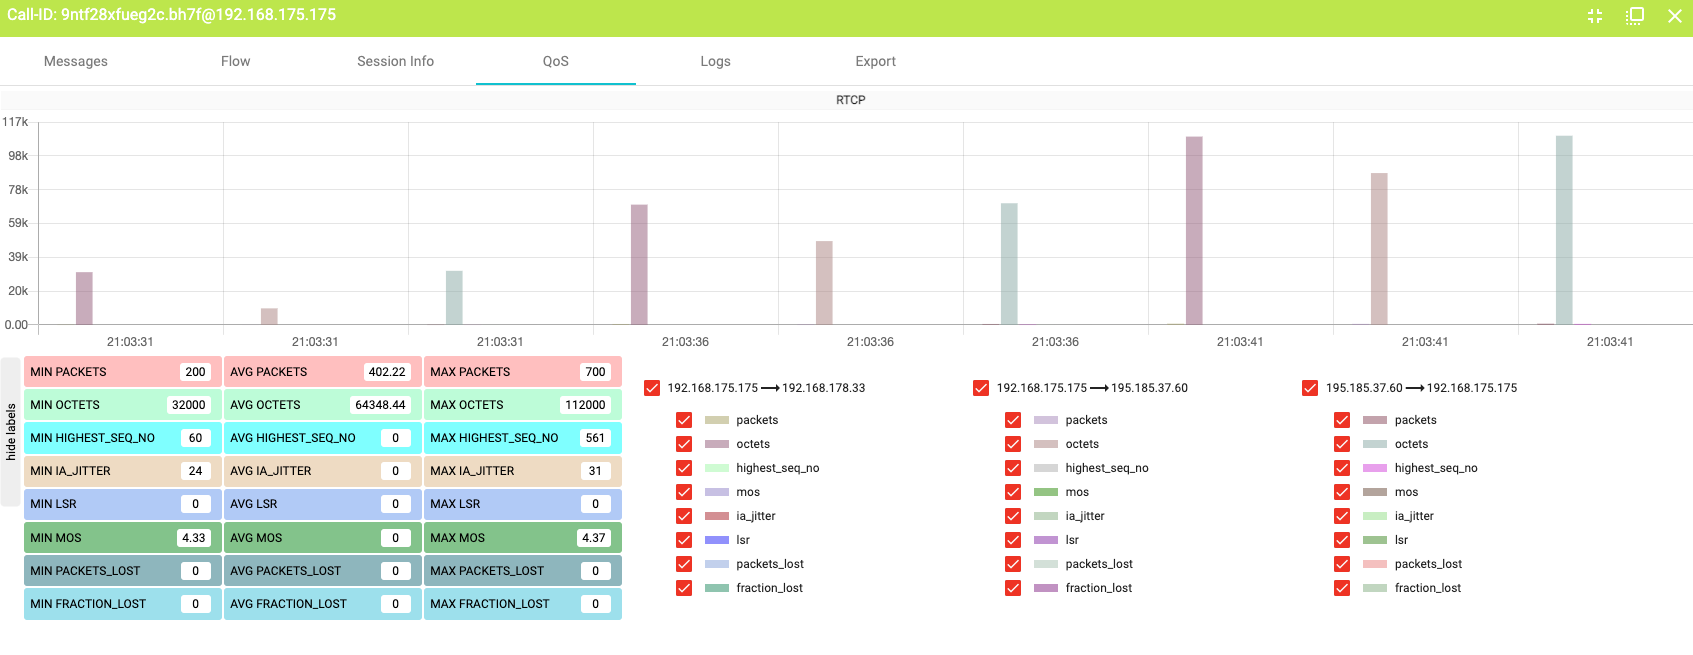
QoS View for all connections:
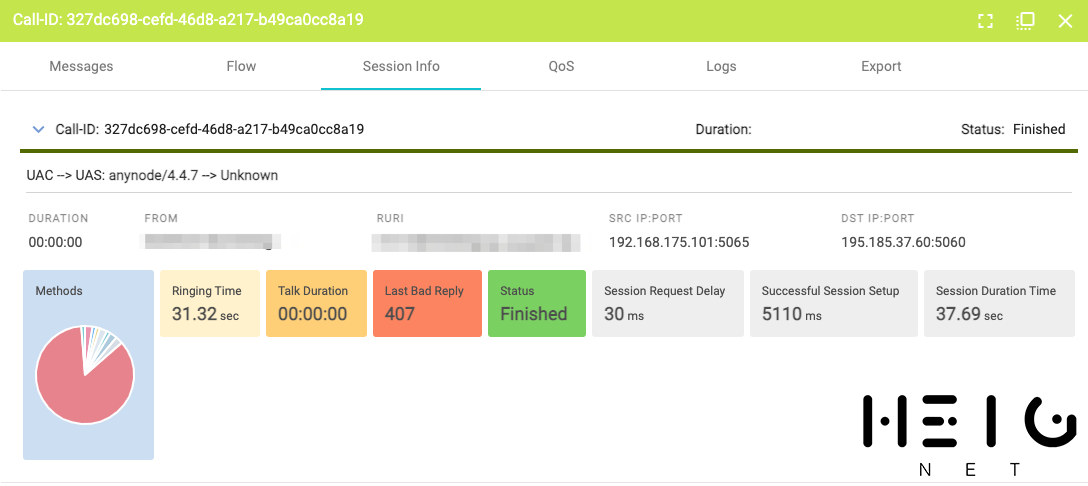
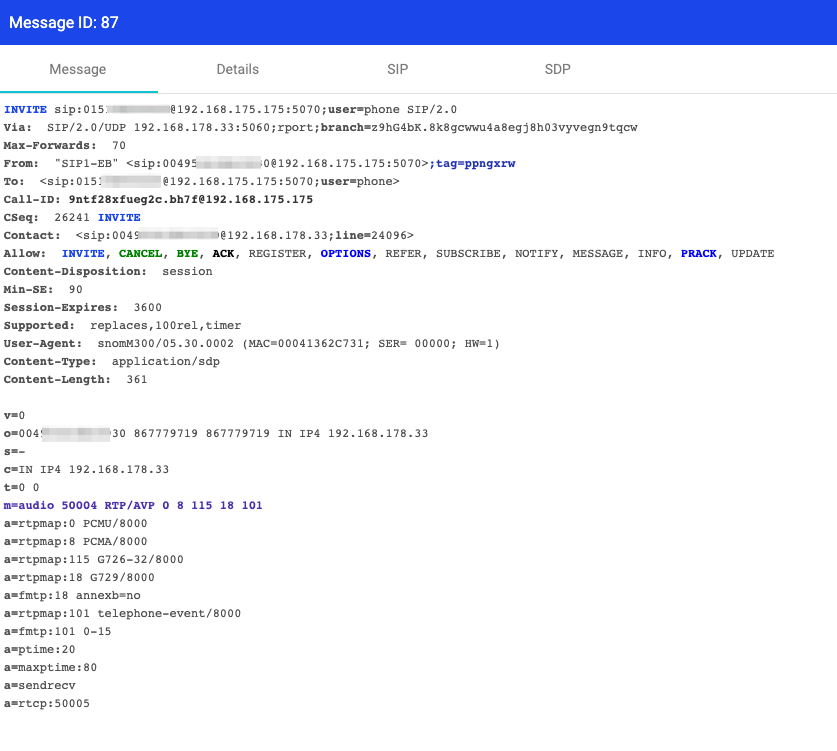
Details of a single SIP Package from the Flow View:
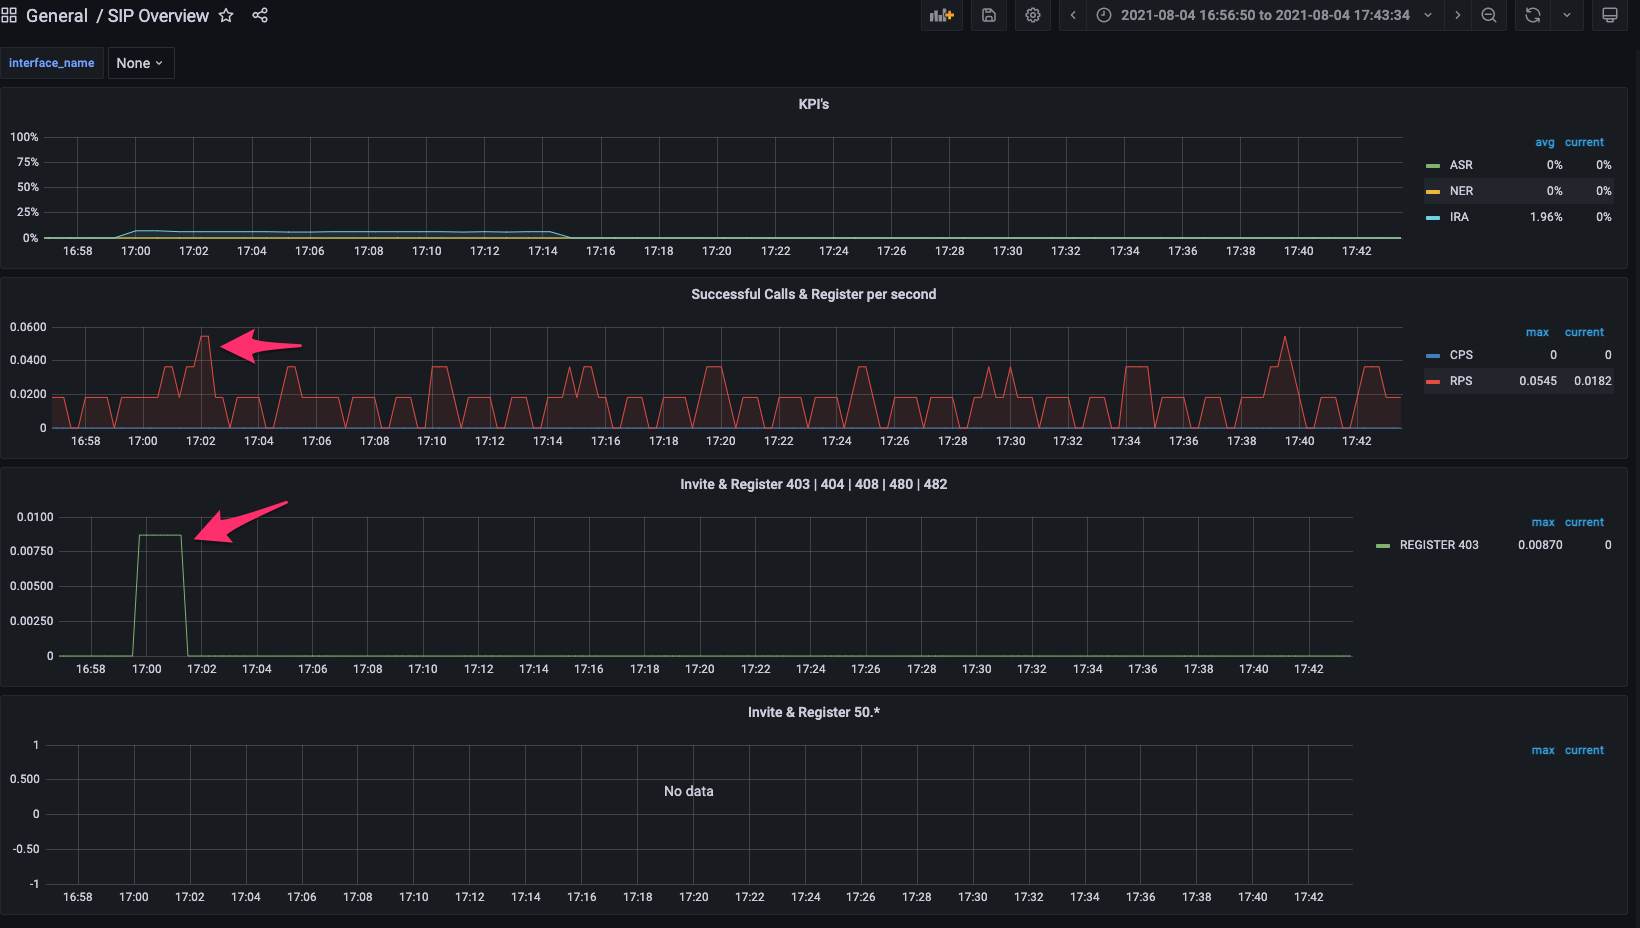
A view from the Grafana Dashbaord. You can see when I was working on the M300 Provisioning Template and had a failed register request:
--
As you can see, you have a really detailed view on every package in the communcation. If you had a closer look, you see that the "Talk Duraton" is give with "00:00:00" - that's a frontend bug that will be patched in the next release.
Whats next?
My tests in my Lab were very promising, so we will roll this out to one of our production system in the next week and see how it handles the load and if it really helps us in on a day-to-day basis to solve support cases. Also I'm very interested in the network and computing load it will create in a real world deployment.
In my next posts I will give you a short introduction in my setup and of course updates on our production tests.